

Canada’s choice: LNG Laggard or Global Clean Tech Leader?
Canada’s Export Choices – LNG Laggard or Global Clean Tech Leader?
Authors: Paul Craig and Ron Loborec
Foreword
Ten years ago, Canada had 22 global oil and gas companies performing due diligence up and down the Canadian West coast. The promised boom failed to materialize. Canada has one major operator, LNG Canada delivering product, and six more projects in various stages of development or planning, representing $109 billion in potential capital investment. So, with the expansion of LNG Canada nominated as a Project of National Interest, will that see Canada becoming a major LNG supplier?
Not in our view.
This paper shows how LNG over supply, stronger competition from other countries, geographic disadvantage, delays and higher costs (per Carbon Tracker Report, Canadian costs up to 60% higher than US Turning_Tides.pdf) will continue to relegate Canada’s LNG status to the back of the pack.
But we also suggest where Canada can gain an early advantage, tuning into demand signals and taking a leading role in emerging LNG alternatives with new and growing trade partners.
Executive Summary
Canada’s LNG ambitions sit amid profound uncertainty and transformation. The demand landscape has changed dramatically – Europe’s gas imports are falling, proximate Asian markets are flattening or contracting, and a global LNG oversupply is expected by the time most Canadian export capacity is fully realized. While Canada’s West Coast projects offer some cost and emissions advantages, these are blunted by late market entry, high capital intensity, and headwinds from lower-cost U.S. and Qatari supply.
Energy literacy is also transforming the risk calculus for LNG. Emissions analyses, once an afterthought, now drive investment and policy, with attention to lifecycle methane leakage and the veracity of “clean” LNG claims.
Most crucially, zero-carbon alternatives- especially ammonia and hydrogen – are accelerating from the conceptual to the commercially demonstrable. Their current cost and supply chain challenges are real, but policy, investment, and international demand all point to the potential for sharp growth for Canadian exports of green ammonia and hydrogen. These carriers offer a direct route to emissions-free trade and are being specifically targeted by the world’s most advanced energy markets.
Canada’s status as a credible, reliable exporter of energy in the 21st century will be defined less by how quickly it scales LNG and more by how successfully it navigates the new logic of clean fuels, international climate ambition, and energy system resilience. If Canada pours billions into 20- to 25-year LNG assets while the world diverts capital to hydrogen and ammonia corridors, those facilities risk becoming stranded before mid-life. Canada needs a dual export strategy – monetize gas now, but invest simultaneously in the next-generation energy carriers.
Shifting our focus away from “bridge fuel” to “clean molecule exporter,” and leveraging both transcontinental tides is a smarter path. Basic impediments to transport and insurance and slow-moving government policy is slowing Canada down versus other countries. Proposed capital investments in LNG would be better spent on pipelines and resolving transport bottlenecks for clean energy exports, positioning Canada as a global thought leader, generating better economic outcomes and lowering global emissions.
It is time for Canada to meet emerging demand and define a responsible and rewarding energy future. Canada’s energy strategy must evolve from “catch-up” to “leap-ahead.”
Let’s not miss the future by focusing on the past.
Introduction
Canada’s liquefied natural gas (LNG) sector stands at a crossroads, with the global energy transition accelerating and old assumptions about LNG’s role, emissions, and economics facing intensifying scrutiny. The urgency of Europe’s pivot away from Russian gas, the evolving energy mix in Asia, and a looming global LNG supply surplus all present both opportunities and profound challenges for Canada. At the same time, growing energy literacy around LNG’s carbon footprint and the emergence of low carbon alternatives such as ammonia and hydrogen are reshaping stakeholder expectations. This report examines Canada’s LNG prospects through three interlinked challenge areas: demand dynamics, energy literacy and emissions awareness, and the promise and perils of alternative energy carriers. Drawing on the latest market data, expert analyses, regulatory perspectives, and technological trends, the analysis situates Canada’s LNG ambitions in the context of a rapidly shifting global landscape.
LNG Demand: Canada’s East and West Opportunities
Eastern Canada: No LNG business case.
The Russian invasion of Ukraine in 2022 set off a seismic shift in European energy sourcing, leading to a sharp reduction in Russian pipeline gas to the EU and a frenzied effort to secure LNG from other suppliers. This upheaval prompted calls within Canada to expedite East Coast LNG projects as a means to support Europe’s diversification away from Russian energy. Yet, prospects for large-scale LNG exports from Eastern Canada are fraught with complexity.
On the demand side, Europe’s initial emergency spike in LNG imports quickly gave way to a determined policy push – most notably through the REPowerEU program – towards reducing gas consumption altogether via efficiency measures and rapid renewable energy deployment. As a result, EU gas demand fell by 18% between 2022 and 2024, enabling pipeline gas from Russia to drop from 45% to 15% of supply and driving LNG’s portion of Europe’s gas mix up temporarily before peaking and retrenching. In 2024 alone, European LNG imports declined 19%, with import terminal utilization falling from 58% to 42%. Forward-looking forecasts suggest a further 26% reduction in European LNG demand by 2030 compared to 2024.
In addition to these demand-side signals, Canadian LNG projects in the east face severe supply-side barriers. Eastern Canada’s resource base is far less developed than the country’s western basins, and infrastructure limitations – such as the absence of established pipeline networks, complex permitting, and challenging coastal geography – translate into high capital costs, slow project timelines, and questionable competitiveness versus U.S., Qatari, and African LNG.
Canada remains a net importer of LNG at the Saint John regasification terminal. The macro context and prohibitive infrastructure gaps – makes large-scale East Coast LNG exports challenging to say the least.
Western Canada: Asian LNG Demand Grows only in the South East – no Canadian advantage
Western Canada, and British Columbia in particular, possesses abundant shale gas resources and direct access to the Pacific. The west coast is now home to Canada’s first wave of LNG export projects – LNG Canada at Kitimat, Woodfibre LNG, Cedar LNG, Ksi Lisims LNG – now at various construction or advanced development stages with over 19 million tonnes per annum of capacity coming online by 2028, potentially expanding to nearly 50 Mtpa by 2029 depending on further investment decisions.
A core premise behind these developments has been to supply the surging energy needs of Asia, benefiting from shorter shipping distances compared to U.S. Gulf Coast terminals (10 days to Tokyo from B.C. vs. 20 days from Texas via the Panama Canal), a temperate climate that reduces liquefaction energy cost, and Canada’s comparatively stringent methane regulations.
But Canada is not the closest supplier to all of Asia. The demand mix there is changing, and not in Canada’s favor.
Japan and South Korea – historically, the world’s largest LNG importers – saw LNG imports fall by 8% and 5% respectively in 2023 as nuclear restarts, energy conservation, and a stronger push for renewables displaced gas demand. Japan’s own Strategic Energy Plan now reaffirmed that, while LNG remains important for energy security, there is declining scope for demand growth post-2030 due to long-term decarbonization goals. Steady demand for LNG remains, growth however, is historic.
China, for its part, has dramatically expanded both domestic gas production and pipeline imports, notably with growing Russian pipeline supply (Power of Siberia 1 ramping up to 38 bcm and Power of Siberia 2 planned at an additional 50 bcm), displacing the need for spot LNG and driving an 8–12% drop in China’s LNG imports through 2025. The emergence of cheap Russian, Central Asian, and domestic gas, as well as accelerating growth in renewables, means China is less likely to absorb large new volumes of LNG in the coming decade, particularly as its economic growth slows.
India’s LNG appetite remains modest. Much of its volume is secured through long-term contracts with Qatar (with supply set to nearly double by 2030), while the economics of coal-to-LNG switching remain challenging given the higher delivered cost of LNG relative to domestic coal.
But within Asia we find other markets emerging where LNG growth can be identified. Wood MacKenzie’s October 2024 Asian LNG Demand Assessment paper predicts that LNG imports will grow 90% to 510 mmtpa by 2050. Given our earlier analysis of steady and falling LNG demand, there must be breakout growth somewhere. Those growth countries are in South and South East Asia. Namely Pakistan, Bangladesh and Sri Lanka in the South, and Indonesia, Malaysia, Myanmar, Philippines, Singapore, Thailand, and Vietnam in the South-East.
Australia, Mozambique and Papua New Guinea are close to these markets and promise steady supply routes. Though Australia has high domestic gas prices, it is faster to market and faces fewer approval steps and interveners than Canada.
With the pause on non FTA permits lifted in January 2025, we expect to see more competitive gas on gas pricing into these markets from the US. With lower global pricing, stimulated by excess supply and competition, demand will more likely continue to grow. Canada, as a high cost producer will not compete well in these markets.
While Canadian LNG is relatively well-positioned on a unit-cost basis for select Asian markets, Canada does not have an advantage over more proximate and faster development that will address demand gaps. It will remain a small global player in LNG markets with high costs and geographic advantage in Asian markets that are falling.
Global LNG Oversupply Concerns and Canadian LNG Competitiveness
The surge in final investment decisions, especially in the U.S. and Qatar, has triggered warnings of a global LNG glut. As of late 2024, global liquefaction capacity stood at 494 Mtpa (65 Bcf/d), with over 210 Mtpa (28 Bcf/d) under construction, a nearly 40% increase in global supply capacity anticipated between 2025 and 2030. Over 1,100 Mtpa of additional LNG proposals are in the pre-FID stage, and major capacity buildouts in the U.S., Qatar, and Australia are likely to keep the market well-supplied into the 2030s.
This looming oversupply is expected to put sustained downward pressure on global LNG prices once new capacity comes online, particularly after 2027. Scenario analysis by S&P, BCG, and the IEA points to several potential outcomes:
- Full Build-Out: If all proposed projects proceed, capacity far outstrips demand, utilization falls below 80%, and prices could collapse to $7–8/MMBtu, below the break-even thresholds for high-cost producers like Canada.
- Selective Growth: Only the most competitive projects advance, supply balances more closely with demand, and prices stabilize around $8–11/MMBtu.
- Stalled Supply: Delays or cancellations constrain supply additions, prices rise above $12/MMBtu, but this is considered increasingly unlikely due to the robustness of capacity under construction.
Canadian LNG projects face high capital costs related to remote construction sites, need to secure long-term offtake agreements, and ongoing ESG and regulatory delays. U.S., Australia, and Qatari LNG producers remain formidable competitors, consistently offering lower production costs and faster execution timelines.
Table: LNG Export Capacity of Canadian Projects (as of 2025)
| Project Name | Export Capacity (Mtpa) | Bcf/d | Status | Estimated Operation |
| LNG Canada Phase 1 | 14 | 1.84 | Operational | June 2025 |
| Woodfibre LNG | 2.1 | 0.28 | Under Construction | 2027 |
| Cedar LNG | 3.3 | 0.39 | Under Construction | 2028 |
| LNG Canada Phase 2 | 14 | 1.84 | Proposed | Awaiting FID |
| Ksi Lisims LNG | 12 | 1.58 | Proposed | Awaiting FID |
| Summit Lake PG LNG | 2.7 | 0.36 | Proposed | Awaiting FID |
| Tilbury LNG Phase 2 | 2.5 | 0.33 | Proposed | Awaiting FID |
Canadian projects must contend with regulatory complexity, appropriate indigenous consultations, and higher capex.
Canadian LNG does enjoy several mitigating advantages relative to some competitors. Its shorter voyage times to Japan and South Korea will see a fair share of market in those steady economies. It also has access to abundant low-cost gas and high well productivity in resource plays like Montney. However, these are more than offset by the combined weight of delayed market entry, high build costs, and a shrinking window of opportunity as clean energy alternatives scale rapidly in key destination markets.
Energy Literacy: The Scrutiny of LNG’s Carbon Footprint
Growing Public Awareness of LNG’s Carbon Footprint
The case for Canadian LNG as a “cleaner” transition fuel rests on two pillars: the prospect of displacing coal in overseas power markets and comparatively low upstream emissions thanks to cleaner electricity for liquefaction. However, quantitative claims about the global emissions benefits of Canadian LNG are no longer going unchallenged.
Regulators and advocacy groups alike have flagged growing discrepancies between industry-reported emissions and top-down satellite measurements, especially regarding methane leakage across the supply chain. Clean Energy Canada, the Pembina Institute, and the International Institute for Sustainable Development (IISD) have all highlighted how new LNG facilities risk undermining both national and international climate commitments.
There is now heightened public and political sensitivity to these considerations in Canada. Advertisements claiming “B.C. LNG will reduce global emissions” have been deemed misleading by Canada’s advertising regulator, Ad Standards, which concluded such statements overstated the certainty of emissions reductions and failed to consider the full lifecycle impact, particularly methane leakage and the crowding-out of renewable investment. The narrative of LNG as a bridge fuel is increasingly scrutinized in light of both the climate crisis and Canada’s obligations to reduce GHG emissions sharply by 2030.
LNG Lifecycle Emissions: Extraction, Liquefaction, Shipping, Regasification, and Use
A careful evaluation of LNG’s greenhouse gas intensity requires a full lifecycle (cradle-to-grave) assessment. Key considerations include:
- Emissions from liquefaction may be much lower in Canadian projects (with hydropower) but are based on projection rather than operating facility measurements.
- Methane slip during shipping is a growing concern, especially for tankers burning boil-off gas (with some engine types leading to emissions 10–45x higher than others).
- Shipping distances from BC are less than from the U.S. Gulf Coast, yielding emissions savings per tonne delivered to Asia.
- Carbon intensity claims for Canadian LNG hinge on the successful, large-scale electrification of all new projects; otherwise, emissions revert to or even exceed global averages.
Other useful comparisons include LNG versus ammonia. The results of a study from OCI November 2022, The decarbonization potential of ammonia as fuel for co-firing – decarbonizing thermal power plants across Europe, (shown below) conclude that LNG has a higher carbon footprint (CFP) than ammonia when used as fuel for co-firing. This study was based on deliveries to the European Union. The combustion of LNG is the most important contributor to the CFP of this product. The analysis also concluded that in terms of percentage change, LNG has a 39.4% higher CFP than low-carbon ammonia on an energy content basis (gCO2/MJ). Finally, when comparing the relative change of LNG with respect to renewable ammonia, it results in a 75.2% higher CFP.

Alternatives: Ammonia and Hydrogen
Ammonia as an Energy Carrier
Ammonia (NH₃) is gaining traction as both a hydrogen carrier and a clean fuel in its own right, particularly for marine shipping applications. It is relatively energy-dense in liquid form, can take advantage of existing infrastructure (storage, ports, pipelines), and is already handled safely at scale in fertilizer and chemical industries worldwide.
Green ammonia production – using renewable electricity for H₂ via electrolysis, then combining with nitrogen via the Haber-Bosch process – is seen as the long-term path to zero-carbon ammonia. Blue ammonia (with natural gas and carbon capture) offers an interim decarbonization route.
Table: Properties of Key Energy Carriers
| Carrier | Technological Readiness | Infrastructure | Emissions Profile | Market Appetite | Safety / Challenges |
| LNG | High | Pipelines, terminals | Moderate -with electrification | Strong (contracts) | Methane slip, GHGs, not zero-carbon |
| Ammonia | Emerging | Existing for fertilizer | Zero-carbon – green | Growing (marine fuel, hydrogen carrier) | Toxicity, NOx, volume, capital costs, lack of standards |
| Hydrogen | Emerging | Limited; evolving | Zero-carbon – green | High (especially in Asia/Europe) | Storage/transport, liquefaction energy, embrittlement risks |
Sources: DNV, CleanShipping Coalition, NRC, IEA, Ammonia Energy Association
As of 2025, ammonia engines are entering service on vessels; port fuel infrastructure is being developed in Japan, the EU, Singapore, and Australia; and Canada is positioning itself to export both blue and green ammonia from BC and Nova Scotia, with projects like EverWind Fuels targeting Europe and Trigon Terminals aiming at Asia.
A 2024 SGMF study found ammonia can achieve up to 61% lower well-to-wake GHG emissions compared to oil-based marine fuels. The International Maritime Organization’s 2050 strategy now mandates sequential and deep carbon intensity reductions for shipping, with net zero required by mid-century – an imperative that green ammonia is well-aligned to meet.
Canada has comparative advantages in renewable resources, deep water port infrastructure on both coasts, and an established ammonia/chemical sector, supporting scale-up of clean ammonia for export.
Hydrogen Shipping: Technological Readiness and Infrastructure
Hydrogen, in pure form, is another fast-evolving candidate for long-distance energy trade. While gaseous hydrogen is lightweight but extremely low in volumetric energy density, technologies for liquefying (LH₂) hydrogen now enable bulk transport by specialized carriers, exemplified by Japan’s Suiso Frontier project and Canada’s first LH₂ liquefaction facility in North Vancouver.
Table: Hydrogen Storage and Shipping Pathways
| Form | Liquefaction Temp | Density (kg/m³) | Suitable for Export | Technology Readiness | Challenges |
| Compressed Gas (CGH2) | — | ~23–39 | No (short-haul) | High | Volume constraints |
| Liquid (LH₂) | –253°C | ~71 | Yes (oceanic) | Demonstration | Liquefaction energy, storage, BOG |
| Ammonia | –33°C | 123 (NH₃) | Yes | Emerging | Toxicity, reconversion costs |
Sources: Oxford Academic Clean Energy, DNV, Nature, HTEC, Hydrogen Insight
Advantages of LH₂ shipping include direct delivery of pure hydrogen to end users (fuel cells, industry) and avoidance of reconversion steps required for ammonia (when not co-fired). The counterbalancing challenges are severe: hydrogen liquefaction consumes 30–40% of energy content, tanks and shipbuilding require advanced cryogenic materials, and boil-off losses are a nontrivial operational risk.
Recent pilot projects (Australia-Japan, HTEC North Vancouver) demonstrate the technical feasibility of cryogenic hydrogen shipping, but widespread adoption will require further cost reduction, standardization of safety and bunkering protocols, and substantial investment in infrastructure at both export and import terminals.
Market Appetite and Policy Direction
Market demand is being primed by regulatory targets (EU, Japan, Korea foresee >10% renewable ammonia/hydrogen content in power and fuel by 2030), investment in decarbonization-ready infrastructure at major ports, and long-term offtake agreements. For example:
- Germany intends to import up to 3–4 million tonnes of hydrogen by 2030, much of it via ammonia from Canada’s east coast and the Middle East, with bilateral supply chains under development.
- Japan’s policy and trading houses are investing heavily in contracts for both blue and green ammonia, with dedicated offtake for co-firing in power plants and marine applications. Mitsubishi and IHI Corporation are both producing ammonia powered turbines
- In Canada, over 80 low-carbon hydrogen and ammonia projects have been announced, representing more than $100B in investment, focused on export readiness, clean fuel infrastructure, and decarbonizing transport and industry.
Table: Comparative Maturity and Market Trends for LNG, Ammonia, and Hydrogen (2025 snapshot)
| Metric | LNG (Methane) | Ammonia | Hydrogen |
| Tech Maturity | High | Emerging | Emerging |
| Infrastructure | Mature | Build-out ramp | Build-out demo |
| GHG (green/blue version) | Moderate/L | Near-zero | Zero (green) |
| End Use | Power, heat, i | Marine, H₂ c. | Industrial, fuel cells |
| Market Growth | Slowing | Rapid, early | Fast ramp, pilot |
| Key Barriers | Methane slip | Cost, safety | Liquefaction, energy |
Sources: IEA, DNV, NRCan, NexantECA
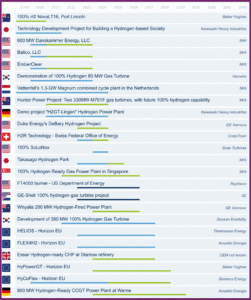
Hydrogen is being used increasingly in gas turbines to produce cleaner electricity. The table below (ETA Hydrogen Gas Turbines October 2024) shows plants of up to 800 MW in development, with many already running as blended natural gas and hydrogen. As we move from fossil fuels, including LNG, hydrogen and ammonia will play a larger part in our energy mix.
In South Korea, The Ministry of Trade, Industry and Energy is promoting ammonia and hydrogen power generation. The commercialization of ammonia co-fired at 20% rate for power generation is estimated to be ready by 2030 and hydrogen co-firing (30% or more) by 2035.
The alignment of Canada’s Clean Fuel Regulations, Investment Tax Credits for clean hydrogen/ammonia, funding for zero-emission vehicles and marine corridors, and international certification protocols all point to a strategic policy tilt toward alternatives and flexible, climate-aligned export pathways. However, Canada needs to do more now to ensure that delivery across provinces and to ports is streamlined.
Conclusion
Shifting our focus away from “bridge fuel” to “clean molecule exporter,” and leveraging both transcontinental tides is a smarter path for Canada. Basic impediments to transport and insurance and slow-moving government policy is slowing Canada down versus other countries.
It is time for Canada to meet emerging demand and define a responsible and rewarding energy future. Canada’s energy strategy must evolve from “catch-up” to “leap-ahead.” Canada must not miss the future by focusing on the past, chasing shrinking markets and avoiding true low emission solutions to be proud of.
